

The development of e-Government applications is one of the indicators of development of economies. It is particularly helpful in providing main services such as education, health services, employment, finance and social welfare. It also deals with the management issues of disasters such as climate change and natural phenomena and works to make the institutions more inclusive, transparent and open. Here, the E-Government Development Index has been developed to be used in measuring the e-Government’s potential contributions.
The E-Government Development Index (EGDI) is published by the United Nations Public Administration Network (UNPAN). The index is a measure of national administrations’ willingness and capacity to use information and communication technologies in the delivery of public services. It started in 2003, and was updated in years 2005, 2008, 2010, 2012, 2014 and 2016. 2016 year study covered 193 countries.
The index is composed of the three most important areas of the e-government: the scope and quality of online services, the state of development of the telecommunication infrastructure, and the human capital. The online service index is created by UN experts by evaluating the national websites of the countries, national center portals, e-service and e-participation portals, as well as web sites of ministries related to education, employment, social services, health, finance and environment. The telecommunication infrastructure index is composed of the estimated number of Internet users per 100 people, the number of fixed telephone lines, the number of mobile subscriptions, the number of wireless broadband subscribers, and the number of fixed broadband internet subscriptions. The human capital index is obtained by weighted average of 1/3 of the adult literacy rate and 1/9 of the components of the primary, middle and high school gross enrollment rate (school enrollment), expected schooling year and average schooling year components .
According to the United Nations’ E-Government Development Index of 2016, 29 countries were very high, 65 countries were high, 67 countries were medium and 32 countries had low EGDI values. It is seen here that many countries have given priority to e-government and have made significant progress in this regard (Graph 1).
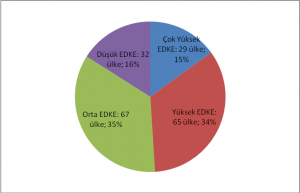
Graph 1. E-Government Development Index, 2016.
Source: UN, E-Government Survey, 2016.